Understanding statistical tools is crucial for analysing data effectively. In this guide, we’ll explore 7 key statistical tools in research and data analysis.
- What are Some Common Statistical Tools Used in Data Analysis?
- Mean (Average)
- Median (Middle Value)
- Mode (Most Frequent Value)
- Standard Deviation (Data Spread)
- Range (Data Spread Width)
- Percentiles (Relative Standing in Data)
- Regression (Finding Relationships)
- Summary: Common Statistical Tools Used in Research
What are Some Common Statistical Tools Used in Data Analysis?
Statistical tools refer to methods and software used to collect, process, analyse, and interpret data. They help researchers understand patterns, test hypotheses, and make informed decisions. Below are key statistical tools, their formulas, and real-world examples to help you apply them correctly.
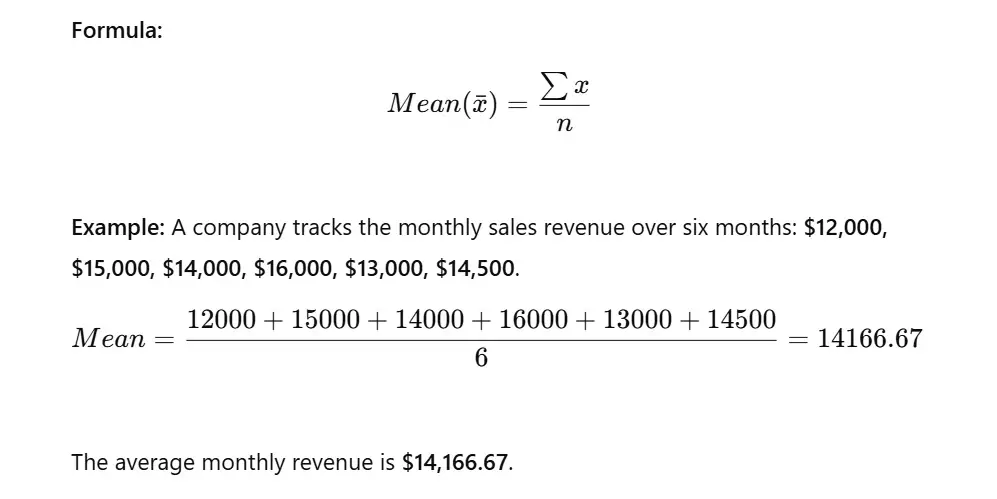
Mean (Average)
The mean is the sum of all values divided by the number of observations. It helps summarize data with a single representative value.
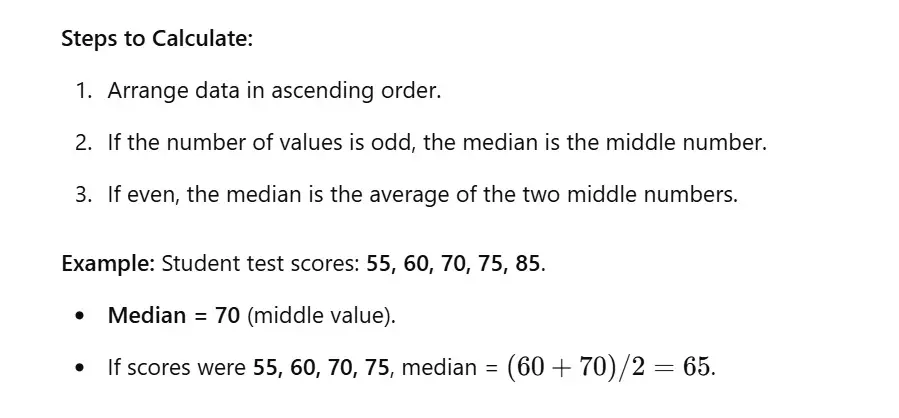
Median (Middle Value)
The median is the middle value when data is arranged in order. It is useful when data has outliers since it is not affected by extreme values.
Mode (Most Frequent Value)
The mode is the most frequently occurring value in a dataset. It helps identify the most common data point.
Example: In a survey of favourite colours: Red, Blue, Blue, Green, Red, Blue, the mode is Blue since it appears most frequently.
Example with Numbers: Given data: 4, 2, 4, 6, 7, 4, 8, the mode is 4.
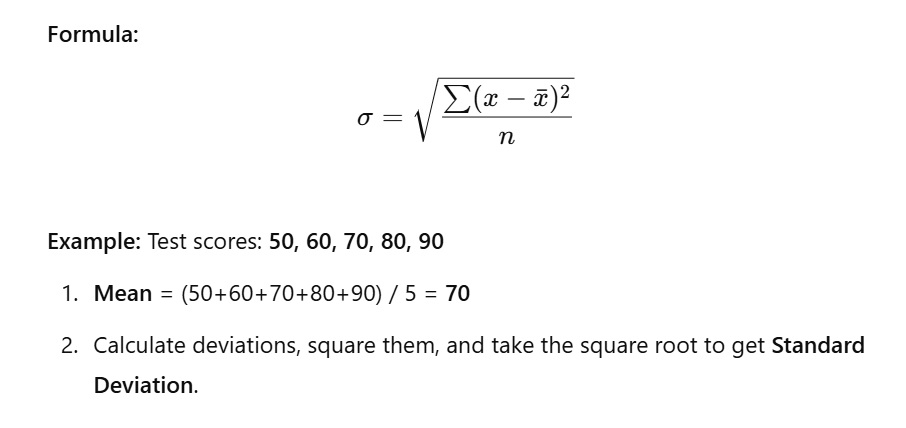
Standard Deviation (Data Spread)
Standard deviation measures how much data deviates from the mean. A low standard deviation means data points are close to the mean, while a high value indicates more spread.
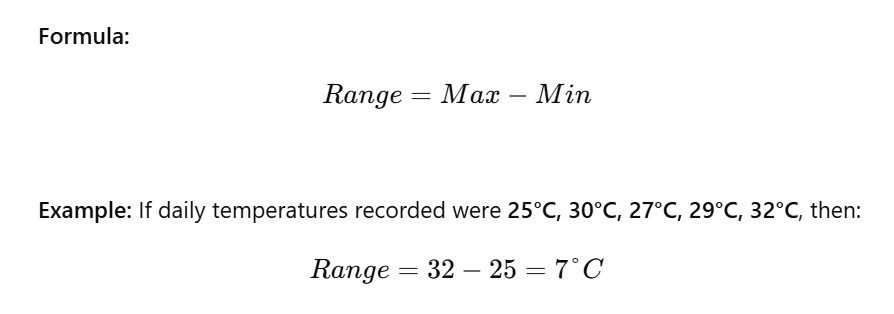
Range (Data Spread Width)
The range shows how widely data is spread and gives a quick measure of variability.
Percentiles (Relative Standing in Data)
Percentiles indicate the relative position of a value within a dataset. They help in comparing performance relative to others.
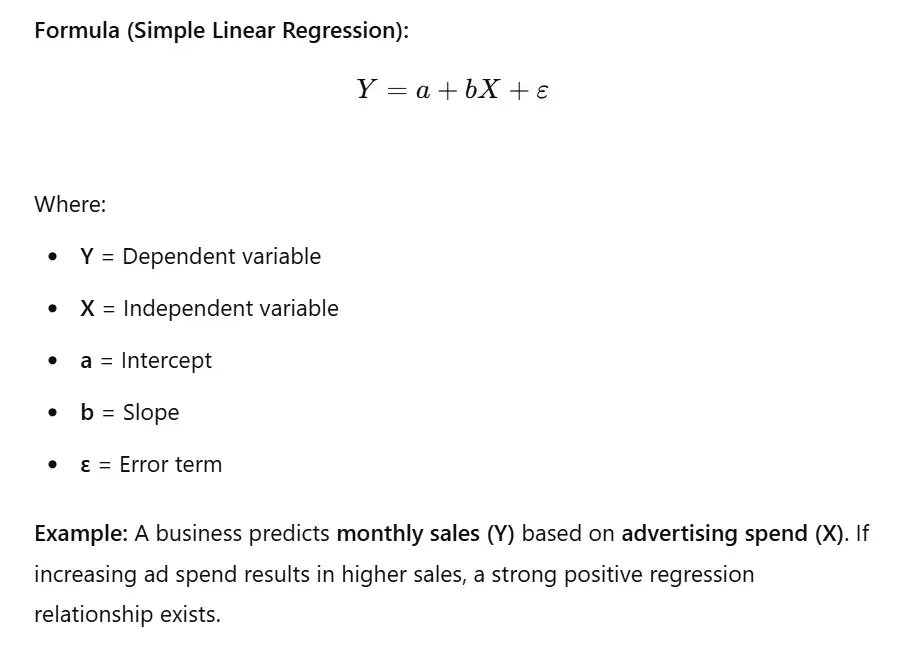
Regression (Finding Relationships)
Regression analysis determines relationships between variables. It helps in predicting outcomes based on input variables.
Summary: Common Statistical Tools Used in Research
Learning these statistical tools will help you make better decisions using data. Use real datasets to practice and analyse trends effectively. Connect us on our YouTube channel for coverage on more such informative topics.