In this guide, we’ll explore the ins and outs of how to draw flow charts, from the basics to crafting complex diagrams. By the end, you’ll be a flowchart superhero, able to showcase your ideas with clear and simple visuals.

Pre-requisites to Draw Flow Chart
A flowchart is like a simple blueprint for any programming task. Learning to draw is like having a secret power to organize your thoughts and processes. It is not difficult to draw flow charts. Once you get the basics right, it will be pretty easy for you to make one.
Flowchart Basics
Before jumping into drawing, let’s get comfy with the ABCs of flowcharts. Think of them like LEGO blocks – you’ve got start and end points, processes, decisions, connectors, and input/output symbols. These building blocks are the foundation for any flowchart.
Flowchart Symbols
The following are the most common symbols to draw flow charts. The table also describes their purpose.
| Sr. | Flowchart Symbol | Description |
|---|---|---|
| 1. | 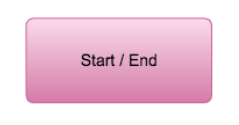 | The oval symbol represents the start and end of a program logic in your flowchart. |
| 2. | 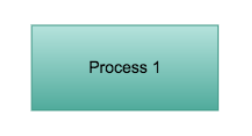 | The rectangle is used to show some processing like a calculation function. |
| 3. |  | The diamond symbol represents a conditional statement. It usually has two paths either true or false. |
| 4. |  | This is a parallelogram symbol. It is used to ask for input and show any data such as the output. |
| 5. | 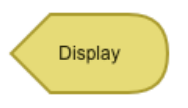 | This symbol is intended for displaying data on any output device such as a computer screen. |
| 6. | 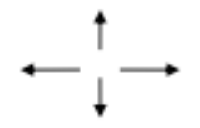 | The arrows represent the sequence of steps and the data flow between two flowchart symbols. |
| 7. | 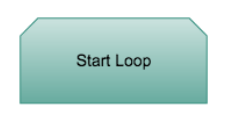 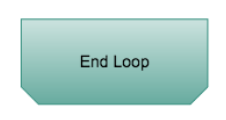 | The “start loop” shape indicates the beginning of an iteration. Its flip shape marks the end of the iteration. |
| 8. | 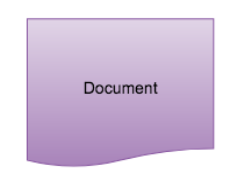 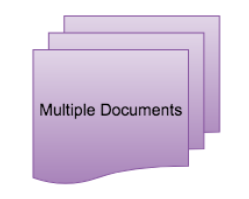 | The top one refers to a single document whereas the latter represents a list docs. They can either be internal or external to the process. |
| 9. |  | This shape introduced a delay in the program flow. |
| 10. |   | The large plus sign inside the circle indicates the logical OR operation. The large cross sign inside the circle indicates the logical AND operation. |
How to Draw Flow Chart
Let’s consider a simple real-life task to demonstrate on how can we draw its logic with a flow chart.
Flow Chart Example
Imagine making a cup of tea. Start at the beginning, flow through boiling water, brewing tea, deciding on sugar or no sugar, and land at the satisfying endpoint.
Drawing a flow chart is like using a secret language that uses symbols, not words. Learn what circles, rectangles, diamonds, and arrows mean, and when to use them. It’s like using emojis to make your texts crystal clear.
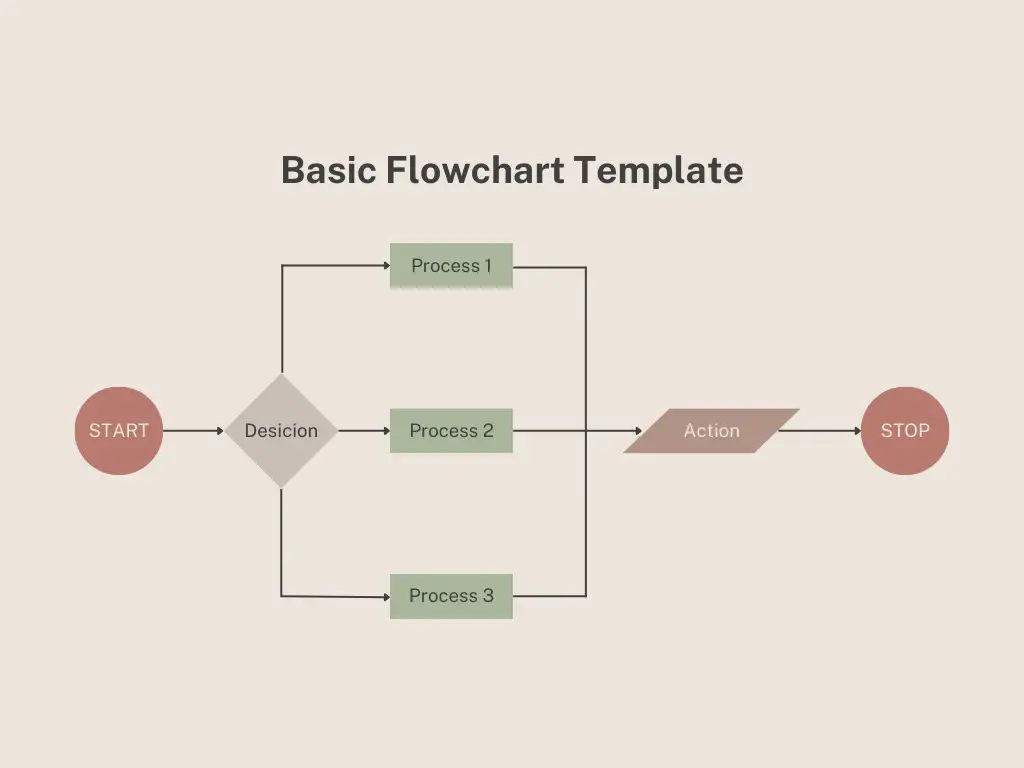
Let’s quickly see what the different shapes are doing in the above diagram.
Steps Involved
Discover more symbols like parallelograms for data stuff, circles for connections, and rectangles with rounded corners for pre-planned processes.
Drawing a flowchart is as easy as following a recipe. Here’s your cooking guide:
Example
Imagine shopping online. Start with picking products, flow through payment decisions, and finally, land on the order confirmation.
Some Important Tips
To make your flowcharts pop, keep these tips in your back pocket:
Examples
Compare a cluttered, overly detailed flowchart with a simplified, easy-to-follow version of the same process.
Here are a few more resources you might be interested in reading:
How to calculate the percentage between two numbers
How to determine the ratio of two numbers
Summary: How did I Learn to Draw a Flow Chart?
Drawing a flowchart is like telling a story with pictures. It’s a superpower that turns confusion into clarity. Now that you’re equipped with the ABCs, symbols, and drawing tricks, go ahead and be the superhero of visualizing ideas. Practice a bit, and gradually, you’ll learn to draw even the trickiest of processes with your flowchart prowess.
Lastly, our site needs your support to remain free. Share this post on social media (Linkedin/Facebook) if you gained some knowledge from this tutorial.
Enjoy Learning,
TechBeamers.


