Today, you’ll learn the most common terminal commands that every Linux/OS X user should know. In this tutorial, we’ve drilled down some of the most important commands that are useful for beginners and essential for DevOps engineers and Sysadmins.
With these terminal commands, one can easily do tasks like monitor system info, disk usage, file management, process management, configure/view network settings, and more.
If you’re working as a DevOps, a SysAdmin, or a C/C++ programmer on Linux, these commands could even be more useful in automating your tasks. We’ve segregated them into five core areas. Please check the table given below.
Those preparing for interviews should also go through this Linux quiz to assess the level of their preparations. And, here is the table of contents for quickly browsing through the list of terminal commands.
50+ Terminal Commands – Linux/OS X Users
1. Check System Memory
1.1. The free command.
It’s the most frequently used command to track memory usage on Linux.
$ free -m

             total       used       free     shared    buffers     cached
Mem:           993        922         71          0         61        216
-/+ buffers/cache:        644        349
Swap:         1023          0       1023
The “-m” option returns the usage data in MB format.
1.2. The </proc/meminfo> command.
Another way to quickly check the memory consumption is by printing the command. You need root or access to run this command.
$ sudo cat /proc/meminfo

MemTotal:        1017536 kB
MemFree:           72092 kB
Buffers:           63160 kB
Cached:           221464 kB
SwapCached:          576 kB
...
1.3. The <vmstat> command.
It reverts with the memory usage in the same way as the command does. But you need not be a root user to run this command.
$ vmstat -s
1017536 K total memory
944492 K used memory
406372 K active memory
239000 K inactive memory
73044 K free memory
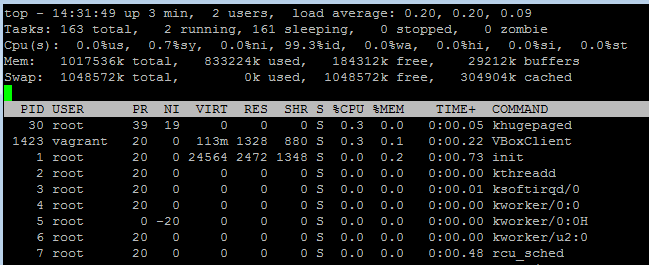
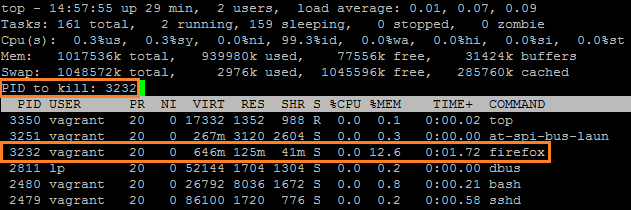
...1.4. The top command.
If you are in a situation of high memory usage (between 90-100%), use the top command to determine the process responsible. You can easily verify the process consuming resources by looking at the <%CPU> or the <%MEM> columns in the top output.
$ top
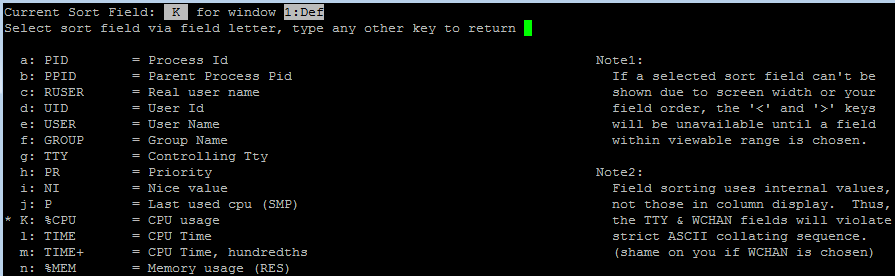
It also allows sorting on the columns. Press (Shift+O) to select a column via field letter. For example, press “a” letter to sort the process with PID (Process ID).
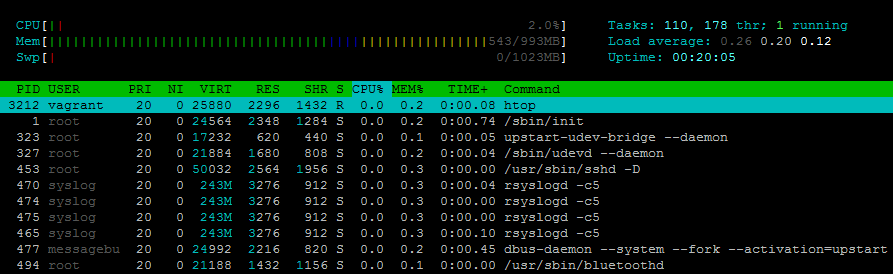
1.5. The <htop> command.
It’s an extension to the top command. And, it provides several other options and details along with displaying the memory usage.
$ htop
The top header in its output shows the CPU usage, RAM, and swap statistics.
1.6. Additional Linux commands to isolate memory issues.
1. Print the top 10 processes consuming a lot of memory.
$ ps aux --sort=-resident|head -11
USER       PID %CPU %MEM    VSZ   RSS TTY      STAT START   TIME COMMAND
root       983  0.3 11.3 286388 115944 tty7    Ss+  14:22   1:11 /usr/bin/X :0 -auth /var/run/lightdm/root/:0 -nolisten tcp vt7 -novtswitch -background none
test       1524  0.9  6.4 1073492 65804 ?       Sl   14:22   2:49 compiz
test       1550  0.0  2.8 745372 28700 ?        Sl   14:22   0:00 nautilus -n
test       1892  1.2  2.3 526612 24372 ?        Sl   14:22   3:45 /usr/lib/unity/unity-panel-service
2. Kill a process while running the top command.
Run top and press “k”. It’ll prompt you for the process ID and ask for the signal to kill. You can enter the PID of your choice and provide 15 as the signal value.
3. Modify the top command to print the absolute path in its output.
After running top, press “c” to display the processes with full path and arguments.
4. Sort “ps” output by memory usage, from high to low.
$ ps aux --sort -rss
Also Read: 30 Linux Questions for Interview
2. Terminal Commands To Check Disk/File Usage.
2.1. The du command.
It’s one of the standard Linux commands to retrieve the disk usage of files and folders.
1. If you wish to check the disk usage of a folder and its subfolder, then run the following command.
$ sudo du /home/techbeamers/
4       /home/techbeamers/.X11-unix
4       /home/techbeamers/VBoxOGL/system
8       /home/techbeamers/VBoxOGL
4       /home/techbeamers/ssh-oWoYdKmZ1162
4       /home/techbeamers/.ICE-unix
4       /home/techbeamers/keyring-z6fUcL
8       /home/techbeamers/pulse-H52d267kpZZH
40      /home/techbeamers/
It displays the output in the form of disk blocks. To print in bytes, kilo bytes, mega, or Gigabytes, use the “-h” option with du command.
2. To check the total space occupied by a directory, use the “-s” option with the du command.
$ sudo du -sh /home/techbeamers
40K     /home/techbeamers
3. Using the “-c” switch will get the total size of the directory including the subdirectories printed at the last line. There is also an “-a” flag to display the usage of all files and folders.
4. The “–exclude” switch lets you specify a file pattern. It makes the du command filter the files matching the given pattern.
$ du -ah --exclude="*.txt" /home/techbeamers
5. Locate the biggest files in the current directory and sub-directories.
$ ls -lSrh
6. Look out for the largest directories.
$ du -kx | egrep -v "\./.+/" | sort -n
2.2. The df command.
Another Linux command to monitor disk space is df (disk-free). Now, let’s see how to use it.
1. Print the disk usage of all the file systems.
$ df -a
Filesystem                   1K-blocks    Used Available Use% Mounted on
/dev/mapper/vagrant--vg-root 129664620 6684216 116370692   6% /
proc                                 0       0         0    - /proc
sysfs                                0       0         0    - /sys
2. Use a fixed memory block size.
By default, it prints memory blocks of 1K. But with the “-B” option, we can alter the default memory size.
$ df -B 100
Filesystem                   100B-blocks     Used  Available Use% Mounted on
/dev/mapper/vagrant--vg-root  1327765709 68446372 1191635887   6% /
udev                             5099439       41    5099398   1% /dev
tmpfs                            1041982     7578    1034404   1% /run
3. Style output to human-readable format.
Use the “-h” option, it makes the display memory in the form of gigabytes, megabytes, etc.
4. Check the type of available file systems.
You can run the df command with the “-T” option to show the type of all file systems.
$ df -T
Filesystem                   Type     1K-blocks    Used Available Use% Mounted on
/dev/mapper/vagrant--vg-root ext4     129664620 6684216 116370692   6% /
udev                         devtmpfs    497992       4    497988   1% /dev
tmpfs                        tmpfs       101756     740    101016   1% /run
You can even exclude a file system with the -x option. Or provide a type with -t option, it’ll result in displaying the same kind of file system.
$ df -t ext2
#OR
$ df -x ext2
2.3. Additional Terminal Commands for File Management.
There are some other useful tips that you can use to optimize your disk management tasks.
1. Delete files marked for deletion but not yet deleted.
$ lsof | grep delete
2. Search for files more than 100 MB.
$ find . -size +100M
3. Check files created within the last one week.
$ find . -mtime -7
4. Remove files older than two weeks.
$ find *.gz -mtime +14 -type f -exec rm {} \;5. Monitor a log file for errors or some text.
$ tail -f file.log | grep -i "error"
Also Read: 30 Basic Linux Questions and Answers
3. Terminal Commands To Check on Running Processes.
3.1. The ps command.
It’s one of the most used Linux commands which returns a preview of the running processes along with their PID, CPU/RAM usage, and other details.
1. Check the Shell you are using.
$ ps -p $
  PID TTY          TIME CMD
 2480 pts/1    00:00:00 bash
2. Check the processes not owned by you.
$ ps aux | grep -v `whoami`
The grep -v option inverts the selection.
3. Remove the grep command while filtering the process list.
$ ps aux | grep '[b]ash'
#Or
$ ps aux | grep bash | grep -v grep
4. Display all processes including params and hierarchy.
$ ps auxww -H
5. List the files opened by a process.
$ lsof -p $PID
6. Print the process running time since it started.
# ps -p -o <PID>,etime=

$ ps -p 1,2233 -o pid,etime=
7. Check all threads of a running process.
$ ps -C firefox -L -o pid,tid,pcpu,state,nlwp,args
  PID   TID %CPU S NLWP COMMAND
 3415  3415  5.1 S   29 /usr/lib/firefox/firefox
 3415  3421  0.0 S   29 /usr/lib/firefox/firefox
 3415  3422  0.0 S   29 /usr/lib/firefox/firefox
 3415  3423  0.0 S   29 /usr/lib/firefox/firefox
 3415  3424  0.0 S   29 /usr/lib/firefox/firefox
3.2. The kill command.
Use case – When you’ve to stop a process behaving intermittently and which refuses to close itself. So the kill command comes for rescue in such conditions. Its syntax is as follows.
$ kill [signal or option] PID(s)
1. Terminate a process by ID.
$ kill -9 PID or kill -KILL PID
The “-9” flag refers to the KILL signal. Some of the other signals are HUP (-1), SIGINT (-2) and TERM (15).
3.2. The killall command.
Another Linux command that kills a process by name is as follows.
$ killall firefox
You can even kill multiple processes using a single command.
$ killall firefox soffice.bin
3.3. The STRACE command.
It is one of the Linux commands which allows watching a process execution. It intercepts the system calls and signals that a program exercises while running.
1. Trace a program using its PID.
$ strace -f -p $PID
2. Monitor a process for any specific system call.
$ strace -e open touch test.txt
open("/etc/ld.so.cache", O_RDONLY|O_CLOEXEC) = 3
open("/lib/x86_64-linux-gnu/librt.so.1", O_RDONLY|O_CLOEXEC) = 3
open("/lib/x86_64-linux-gnu/libc.so.6", O_RDONLY|O_CLOEXEC) = 3
open("/lib/x86_64-linux-gnu/libpthread.so.0", O_RDONLY|O_CLOEXEC) = 3
open("/usr/lib/locale/locale-archive", O_RDONLY|O_CLOEXEC) = 3
open("test.txt", O_WRONLY|O_CREAT|O_NOCTTY|O_NONBLOCK, 0666) = 3
3.4. The watch command.
Sometimes, we need to monitor a process at regular intervals. For example, track the progress of copying a large release build or folder. That’s where the watch command is useful.
1. Run the ls command after every 1 second.
$ watch -n 1 ls -l
2. See the differences between previous and present output.
$ watch -d -n 1 free
You can anytime press CTRL+z to take control back from the watch command.
Also Read: Linux Commands Cheat Sheet
4. Terminal Commands To Monitor & Manage Network.
4.1. The IFCONFIG and related commands.
The most common usage of the command is to return the IP address of the system you are using. But you can also use it to initialize an interface, assign a new IP address, and enable/disable the interface.
1. The below command will print the IP address of the current machine.
$ ifconfig
eth0      Link encap:Ethernet  HWaddr 08:00:27:4d:2e:ff
          inet6 addr: fe80::a00:27ff:fe4d:2eff/64 Scope:Link
          UP BROADCAST RUNNING MULTICAST  MTU:1500  Metric:1
          RX packets:0 errors:0 dropped:0 overruns:0 frame:0
          TX packets:1999 errors:0 dropped:0 overruns:0 carrier:0
          collisions:0 txqueuelen:1000
          RX bytes:0 (0.0 B)  TX bytes:400055 (400.0 KB)

eth1      Link encap:Ethernet  HWaddr 08:00:27:d8:13:46
          inet addr:192.168.1.6  Bcast:192.168.1.255  Mask:255.255.255.0
          inet6 addr: fe80::a00:27ff:fed8:1346/64 Scope:Link
          UP BROADCAST RUNNING MULTICAST  MTU:1500  Metric:1
          RX packets:16660 errors:0 dropped:0 overruns:0 frame:0
          TX packets:16506 errors:0 dropped:0 overruns:0 carrier:0
          collisions:0 txqueuelen:1000
          RX bytes:10200264 (10.2 MB)  TX bytes:2778520 (2.7 MB)
2. To print the information related to a particular interface, run the following.
$ ifconfig eth0
3. Assign an IP address and set a gateway.
$ ifconfig eth0 192.168.1.1 netmask 255.255.255.0
4. Enable/disable an interface.
$ ifup eth0
$ ifdown eth0
4.2. Some nice ping command examples.
It’s basically to find whether a machine on the network or the gateway is reachable. Here are some good examples.
1. Increase/decrease ping time interval.
$ ping -i 2 target
$ ping -i 0.1 target
2. Check if local I/F is active.
$ ping 0
$ ping localhost
3. Update the size of the ping packet.
$ ping -s 112 localhost
The above command changes the default packet size from 56 to 112.
4. Timeout a ping request.
$ ping -w 5 localhost
5. Send X no. of packets and stop.
$ ping -c X IP_ADDRESS
4.3. The TRACEROUTE command.
It’s for troubleshooting the network issues. It prints the number of hops taken to reach the target.
$ traceroute ubuntu.com
traceroute to ubuntu.com (91.189.94.40), 30 hops max, 60 byte packets
 1  D-Link.Home (192.168.1.1)  4.566 ms  4.960 ms  5.038 ms
 2  abts-north-static-236.220.160.122.airtelbroadband.in (122.160.220.236)  36.117 ms  37.111 ms  38.686 ms
 3  abts-north-static-181.130.160.122.airtelbroadband.in (122.160.130.181)  39.867 ms  41.269 ms *
4.4. The NETSTAT command.
This command allows a user to monitor both incoming and outgoing network connections. Most of the operating systems support this command. Let’s see some of its real-time applications.
1. Listing all TCP and UDP connections opened at a time.
$ netstat -a | more
2. List connections without resolving host, port, and user name.
$ netstat -an
3. Listing only TCP connections.
$ netstat -at
4. Listing only UDP connections.
$ netstat -au
5. Display TCP connections in the Listen state.
$ netstat -lt
6. Display UDP connections in the Listen state.
$ netstat -lu
7. Display service names with PID.
$ netstat -tp
8. Print routing table summary.
$ netstat -r
9. Retrieve IP address statistics.
$ netstat -g
10. Locate all programs in the Listen state.
$ netstat -ap | grep http
11. Find the port of a program is using.
$ netstat -ap | grep ssh
12. Show all ports listening with process PID.
$ netstat -tlnp
4.5. The dig command.
The full form of the DIG command is domain information groper. It retrieves the DNS details like A record, CNAME, and MX records.
$ dig www.google.com
; <<>> DiG 9.8.1-P1 <<>> www.google.com
;; global options: +cmd
;; Got answer:
;; ->>HEADER< ;; flags: qr rd ra; QUERY: 1, ANSWER: 1, AUTHORITY: 0, ADDITIONAL: 0

;; QUESTION SECTION:
;www.google.com. IN A

;; ANSWER SECTION:
www.google.com. 261 IN A 216.58.196.68

;; Query time: 35 msec
;; SERVER: 127.0.0.1#53(127.0.0.1)
;; WHEN: Thu Sep 8 16:55:01 2016
;; MSG SIZE rcvd: 48
1. Display only MX Records.
$ dig -t MX ubuntu.com +noall +answer

; <<>> DiG 9.8.1-P1 <<>> -t MX ubuntu.com +noall +answer
;; global options: +cmd
ubuntu.com. 2845 IN MX 10 mx.canonical.com.
2. Display only NS Records.
$ dig -t NS ubuntu.com +noall +answer

; <<>> DiG 9.8.1-P1 <<>> -t NS ubuntu.com +noall +answer
;; global options: +cmd
ubuntu.com. 1328 IN NS ns3.p27.dynect.net.
ubuntu.com. 1328 IN NS ns2.p27.dynect.net.
ubuntu.com. 1328 IN NS ns4.p27.dynect.net.
ubuntu.com. 1328 IN NS ns1.p27.dynect.net.
4.6. Miscellaneous network Linux commands.
1. Display all TCP sockets in use.
$ lsof -nPi tcp
COMMAND PID USER FD TYPE DEVICE SIZE/OFF NODE NAME
ubuntu-ge 1957 vagrant 11u IPv4 12280 0t0 TCP 192.168.1.6:42056->91.189.94.25:80 (CLOSE_WAIT)
2. Resolve the IP address from the hostname.
$ host ubuntu.com
3. MTR – Top-like traceroute command.
It combines the functionality of traceroute and ping tools. It examines the connectivity between the host and the given target system.
$ mtr google.com
Also Read: 7 Linux Commands for Programmers
5. Linux Commands To Configure Terminal & Screen.
5.1. The screen command.
It might now be available on your system by default. So, to install it either use apt or yum as per the distribution you are using.
1. Start a screen session as the current user.
$ screen -x
2. Reattach to a screen session.
$ screen -r
3. Record a terminal session.
$ script file.out 2> file.rec
4. Play back a recorded terminal session.
$ scriptreplay file.rec file.out
5.2. Some Useful Terminal Command Shortcuts.
1. Open a new terminal.
Press CTRL+ALT+t
2. Open a new tab in the existing terminal window.
Press CTRL+SHIFT+t
3. Clear the screen.
Press CTRL+l or type clear and enter.
4. Cache console output.
$ script my.terminal.session
6. Some Important Terminal Commands for Quick Reference.
1. How to run a previous command as root?
$ sudo !!
2. How to find differences between two directories?
$ diff -y <(ls -l ${DIR1}) <(ls -l ${DIR2})3. How to lock a directory.
$ chmod 0000 /test
The root user will still have access. To restore the permission, run the below command.
$ chmod 0755 /test
4. Smart cd commands.
#To change to last working directory.
$ cd -

#To return to your home directory.
$ cd
5. How to replace the same text in multiple files.
To replace the text Apple with Linux in all text files in the current directory and down you can run this.
$ find . -name '*.txt' -print | xargs perl -pi -e's/Apple/Linux/ig' *.txt
6. Listing files changed today.
Sometimes, we create a file during the day and forget what name we gave it. So here is the command to locate such files.
$ ls -al --time-style=+%D | grep `date +%D`
7. Shorten long commands.
Not all of us can memorize the long Linux commands. With the below command, we can assign user-friendly names in such cases.
$ alias ls="ls -al"
8. Copy a file into multiple directories.
$ echo /home/dir1 /test/dir2 /prod/dir3 | xargs -n 1 cp -v /path/to/file
9. Disable incoming ping requests.
To block a flood of incoming pings, do the following.
$ sysctl -w net.ipv4.icmp_echo_ignore_all=1
To turn the above setting back, run the below command.
$ sysctl -w net.ipv4.icmp_echo_ignore_all=0
10. Some cool Nautilus tricks.
- Press CTRL+l to open a location.
- Use CTRL+up to open the parent directory.
- Press the arrow keys to navigate through folders.
Checkout: Unix Shell Scripting Quiz (25 Best Questions)
Before You Leave
If you liked our explanation of top terminal commands on Linux and Mac OS X, share this post on social media (Linkedin/Twitter). We hope you gained some knowledge from this tutorial.
Enjoy coding,
TechBeamers.