Want to learn – what is Grafana? Let us explain – It is a tool that helps you watch your systems – like websites, apps, servers – and understand what’s going on with them.
It doesn’t store data by itself. It takes data from other tools you already use – like metrics, logs, or uptime info – and shows it as clean charts and dashboards.
This makes it easy to spot problems early. Like if something is slow, using too much memory, or completely down – Grafana helps you see it fast. And it can also send alerts when something goes wrong, so you don’t miss it.
Simple idea, but really powerful when you need to keep your systems healthy.
If you want to know how Grafana works, what it does, who owns it, and where it’s used – this guide explains everything in very simple words.
✅ What Is Grafana?
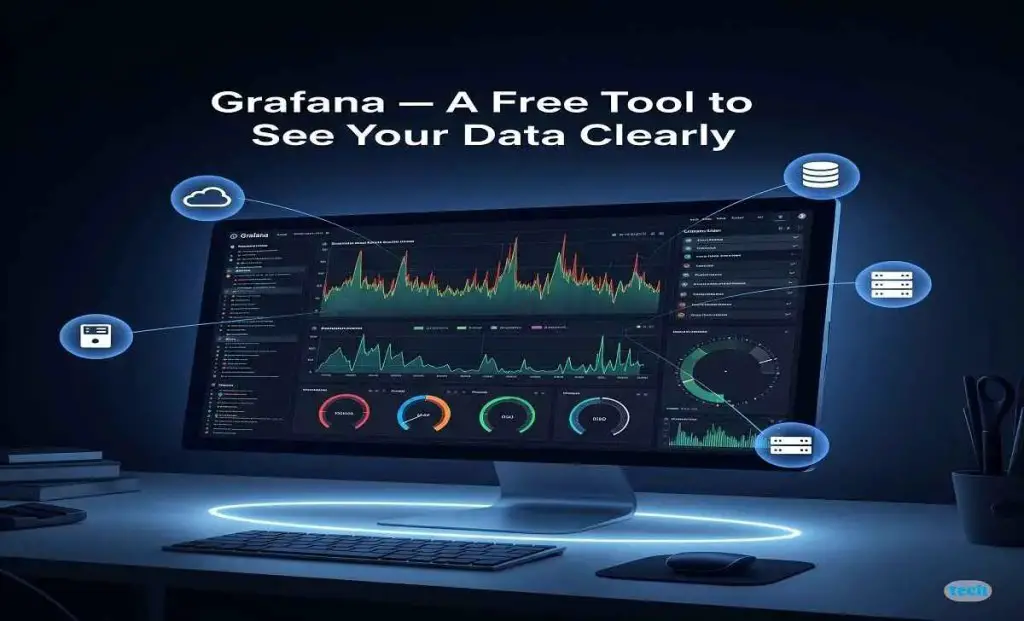
Grafana is a free tool that turns raw data into clear, colorful visuals like charts and dashboards. It doesn’t collect data itself. Instead, it connects to other tools where your data already lives. Once it has the data, it shows it in a nice and easy-to-understand way.
This helps teams see problems early, check how systems are running, or even look at business numbers. You don’t need to be a tech expert to use Grafana. Its clean look and easy setup make it popular for beginners too.
✅ What Does Grafana Do?
Grafana is a free tool that helps you easily understand what your data is telling you. It doesn’t hold the data itself but connects to other places where your data lives, like servers, apps, or monitoring tools. After connecting, Grafana shows that data as clear and colorful charts and dashboards.
This helps you quickly see if your systems are running well or if something needs attention. It keeps all important info together so managing your tech becomes much simpler.
In simple terms, Grafana helps you:
- See your data as easy charts and dashboards
- Watch your systems all the time, day and night
- Spot problems like errors or slowdowns quickly
- Set up alerts that tell you right away when something is wrong
- Make sense of complicated data in a simple way
✅ What Is Grafana Used For?
People use Grafana in many places where data needs to be watched closely. Whether it’s a small blog, a mobile app, or a big business system — Grafana fits all.
Here’s how people use it:
Tech and IT teams:
They use Grafana to watch servers, CPU load, network speed, and logs. If anything breaks or slows down, Grafana tells them right away.
Cloud monitoring:
Grafana connects with cloud services like AWS, Azure, and Google Cloud. It shows all cloud data in one easy place.
Developers:
Developers check how new features affect speed, traffic, or errors using Grafana. This helps improve their apps.
Businesses:
Businesses use Grafana to track important numbers like sales, visitors, or revenue on live dashboards.
IoT and smart devices:
Grafana shows live sensor data from machines, vehicles, or factories. It helps monitor these things in real time.
✅ How Does Grafana Work?
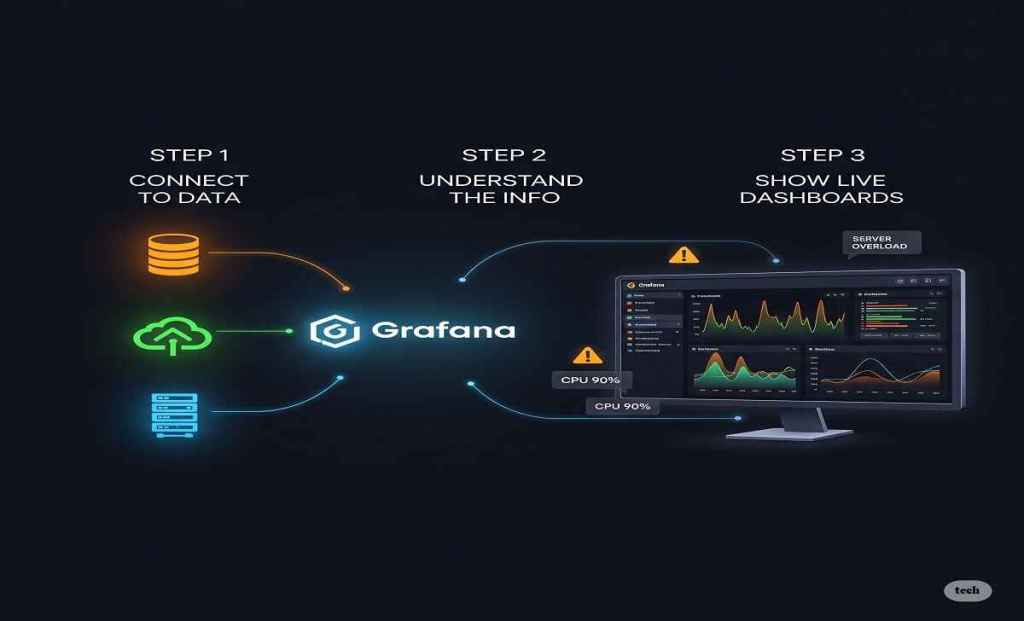
Grafana works in three simple steps. First, it connects to your data — from places like Prometheus, MySQL, or Google Cloud.
Second, it reads the data for you. You don’t need to know coding. Just say what you want to check, like CPU use or user visits, and Grafana finds the data.
Third, it shows your data in easy dashboards. You pick charts, graphs, or tables, and everything updates live.
You can also set alerts. If something breaks — like a server goes down — Grafana sends you a message by email, SMS, or Slack so you can fix it fast.
✅ Who Owns Grafana?
Grafana was created by a developer named Torkel Ödegaard. He made it as a free tool anyone can use.
Today, a company called Grafana Labs manages Grafana. It started in 2014, with Torkel and two others, Raj Dutt and Anthony Woods, leading it.
Grafana stays free for everyone, but Grafana Labs also offers paid options with more features and support for bigger businesses.
✅ Why So Many People Like Grafana?
Grafana is loved by developers, IT teams, and even non-tech people. That’s because it’s flexible, simple, and powerful — all at once.
Here’s why people choose Grafana:
- It’s free and open-source
- It works with many popular data tools
- Dashboards are easy to build and read
- It gives real-time updates
- You can add plugins and new features
- It supports alerts and notifications
Whether you’re running a single app or managing hundreds of machines, Grafana keeps you informed in real-time.
✅ Quick Recap: Common Questions Answered
| 🔍 Question | 💡 Short Answer |
|---|---|
| What is Grafana? | It’s a tool that shows data in charts and dashboards. |
| What does Grafana do? | It helps monitor systems and alerts you when something is wrong. |
| How does Grafana work? | It connects to your data, reads it, and shows it live in dashboards. |
| What is Grafana used for? | Used to track servers, apps, websites, clouds, and business numbers. |
| Who owns Grafana? | It’s managed by Grafana Labs, co-founded by its original creator. |
🟢 Final Thoughts
Grafana makes it easier to watch your data and act before problems grow. It helps teams stay calm and confident, even when systems get busy. You don’t have to guess what’s wrong — Grafana shows you everything clearly.
If you’re running any system that needs to stay up and running, Grafana is a smart tool to learn. It’s trusted, flexible, and speaks the language of data in a visual way.
✅ FAQ Section
❓ What Grafana is exactly?
Sometimes, you got data coming from many places, and it’s hard to make sense of it. Grafana helps with this. It’s a free tool that shows your data in simple charts and dashboards, so you can easily see what’s happening in your system.
❓ Why people are using Grafana?
Because when you run servers, apps, or cloud stuff, you need to know if things are working fine. Grafana helps people keep an eye on all that. It shows problems early, before they get bigger.
❓ How Grafana does work actually?
The way it works is simple. First, Grafana connects to your data — maybe from database, cloud, or some tool. Then it finds the data you ask for, like server health or user visits. After that, it shows this in live dashboards. You can also add alerts if anything goes wrong.
❓ Is Grafana free to use or not?
Yes, it’s free. Anyone can download and use it. It’s open-source. But also, if you want more features for company use, they offer paid plans.
❓ Who is managing Grafana now?
A company called Grafana Labs is running it now. The main person who made it, Torkel Ödegaard, started the company with two others. They still lead and work on the tool.
❓ Is Grafana only for tech experts or not?
No, not just for techies. Grafana is made in a way that even non-tech people can use it. You don’t need to be a pro to create dashboards and understand your data.
❓ Does Grafana send alerts or not?
Yes, it does. When something is not right, Grafana can send you alerts through email, SMS, or tools like Slack. So, you can fix the issue quickly.