The Mean is the most suitable statistical measure to represent the average of a dataset. It gives a single value to summarize a complete range of values. Its simplicity make it useful for comparison and analysis.
📊 What are some common statistical measures used in data analysis?
Mean to Represent the Average of a Dataset
The Mean is result of summing all values in the dataset and dividing by the sample size.
How to Calculate Mean (Formula)?

Example 1: Daily Sales Revenue
A store records its daily sales for five days: $200, $250, $180, $300, and $270.

So, the average daily sales revenue is $240.
Let’s create a bar graph to visually illustrate the concept of the mean and how it represents the average of a dataset.

Example 2: Student Test Scores
A student receives the following test scores: 75, 80, 95, 60, and 90.
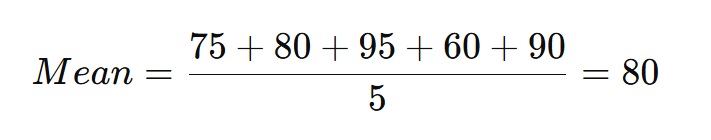
The average test score is 80.

Why is the Mean Important?
It is important because of its simplicity in calculation. It is straightforward to measure and simple to use for the analysis.
- Summarizes Data – Provides a single representative value.
- Easy to Compute – Simple formula applicable in various fields.
- Used in Comparisons – Helps compare datasets (e.g., average salaries in different companies).
However, you should remember the fact that mean may not work with extreme values (outliers). So in such cases, median might be a better measure of central tendency. Want more topics to be covered like this? Subscribe to our YouTube channel.